> For the complete documentation index, see [llms.txt](https://docs.imdcinsights.com/llms.txt). Markdown versions of documentation pages are available by appending `.md` to page URLs; this page is available as [Markdown](https://docs.imdcinsights.com/ying-yong-zhong-xin/shu-ju-yu-fen-xi/grafana-kuai-su-ru-men.md).
# Grafana快速入门
部署 创达睿通 提供的 Grafana 之后,请参考下面的步骤快速入门。
### 准备[](https://support.websoft9.com/docs/grafana#%E5%87%86%E5%A4%87)
1. 在云控制台获取您的 **服务器公网 IP 地址**
2. 在云控制台安全组中,检查 **Inbound(入)规则** 下的 **TCP:80** 端口是否开启
3. 在服务器中查看 Grafana 的 **默认账号和密码**
4. 若想用域名访问 Grafana,务必先完成\*\*域名五步设置\*\* 过程
### Grafana 初始化向导[](https://support.websoft9.com/docs/grafana#grafana-%E5%88%9D%E5%A7%8B%E5%8C%96%E5%90%91%E5%AF%BC)
#### 详细步骤[](https://support.websoft9.com/docs/grafana#%E8%AF%A6%E7%BB%86%E6%AD%A5%E9%AA%A4)
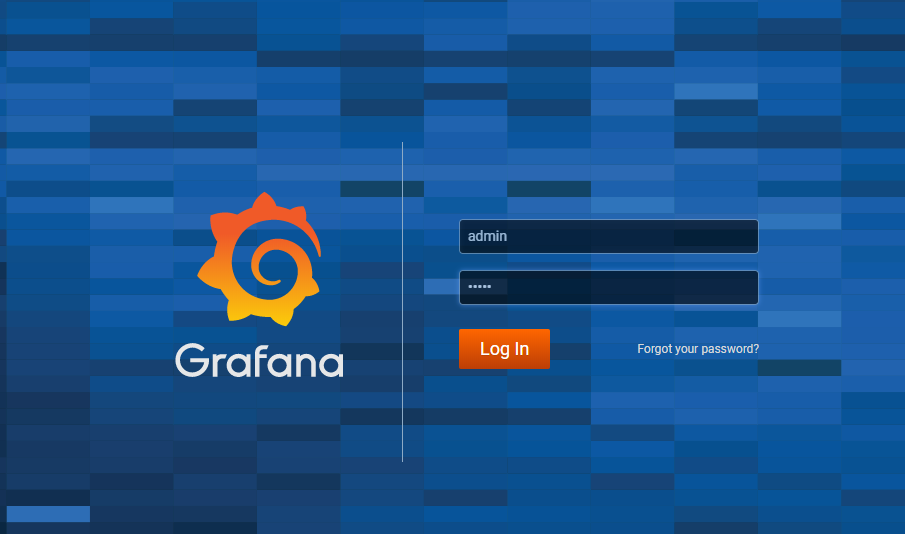
1. 使用本地电脑的浏览器访问网址: ** 或 **, 就进入登录页面
2. 输入默认的用户名和密码
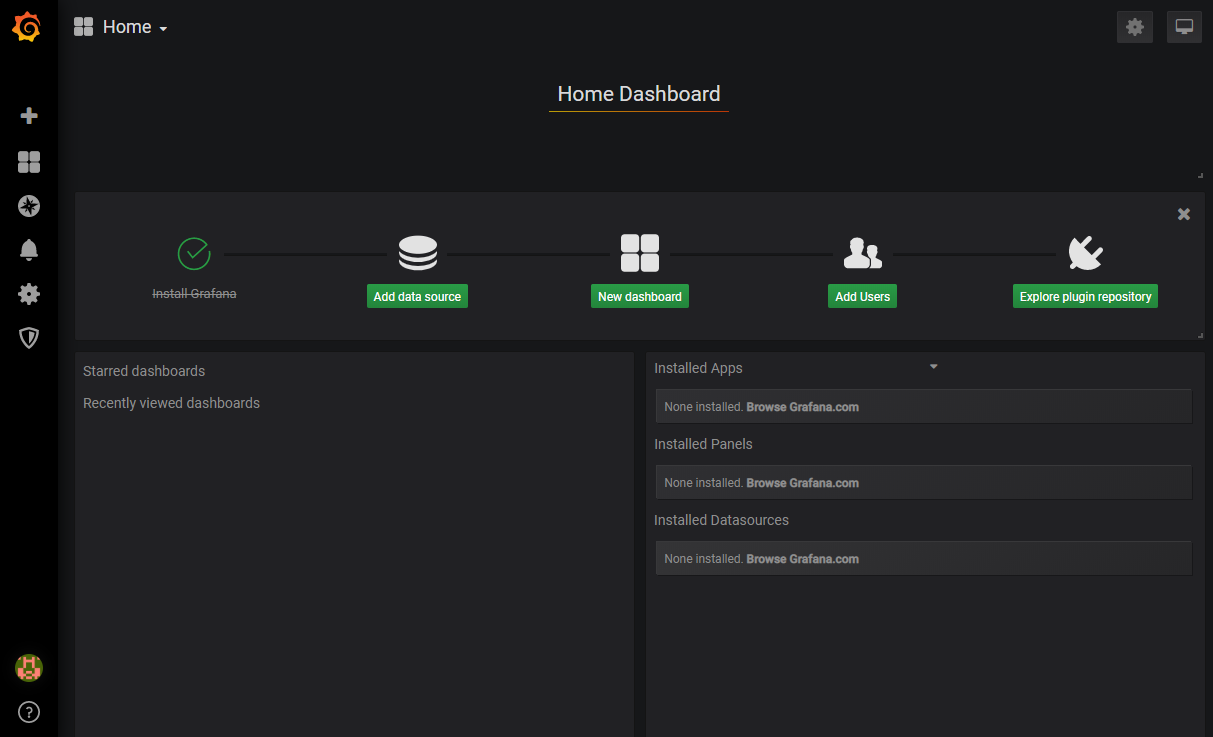
3. 登录到 Grafana 控制台页面
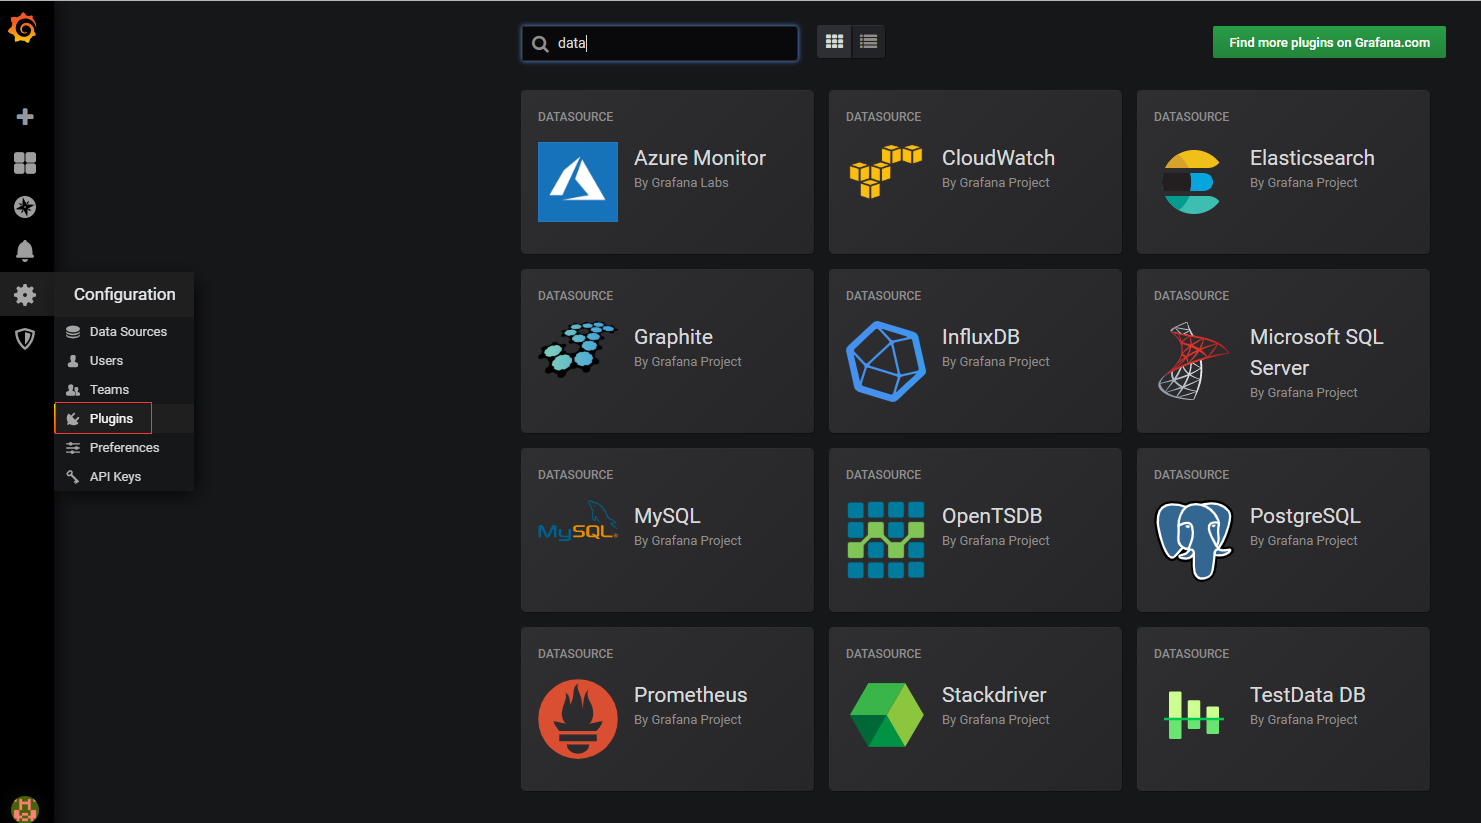
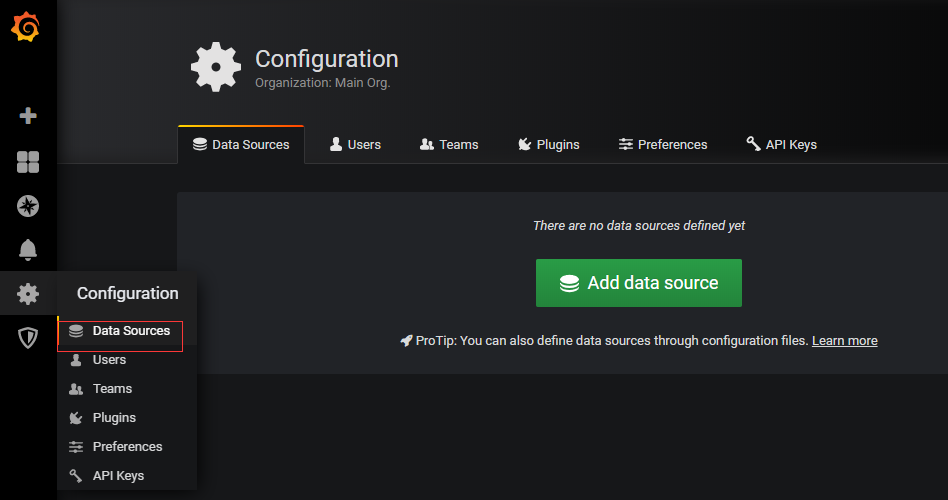
4. 通过【Configuration】>【Plugins】添加插件
5. 通过【Configuration】>【Data Sources】添加数据源(分析对象)
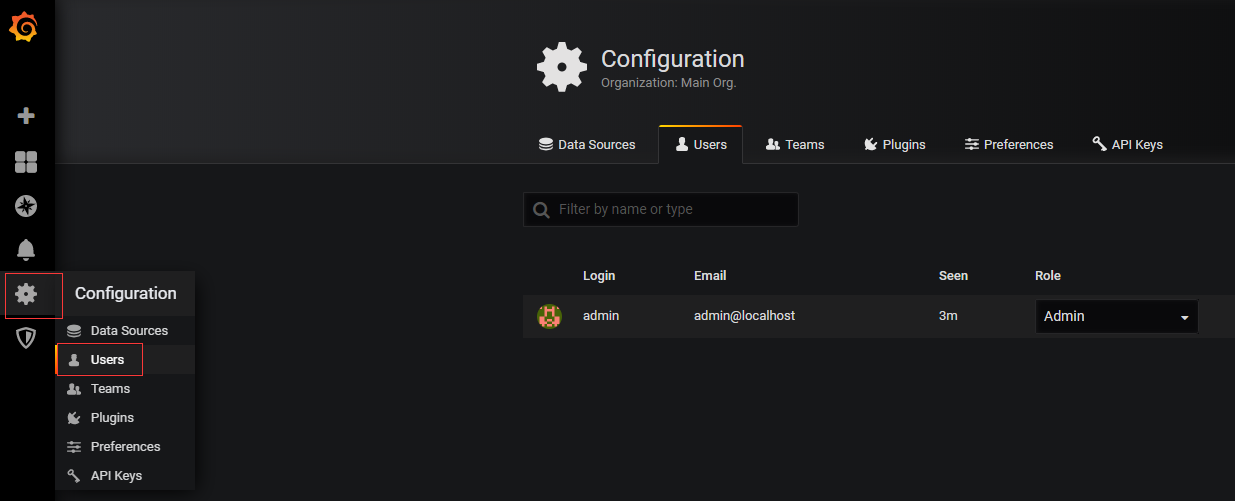
6. 通过【Configuration】>【Users】增加用户
> 需要了解更多 Grafana 的使用,请参考官方文档:Grafana Documentation
#### 出现问题?[](https://support.websoft9.com/docs/grafana#%E5%87%BA%E7%8E%B0%E9%97%AE%E9%A2%98)
若碰到问题,请第一时刻联系 **技术支持**。也可以先参考下面列出的问题定位或 **FAQ** 尝试快速解决问题。
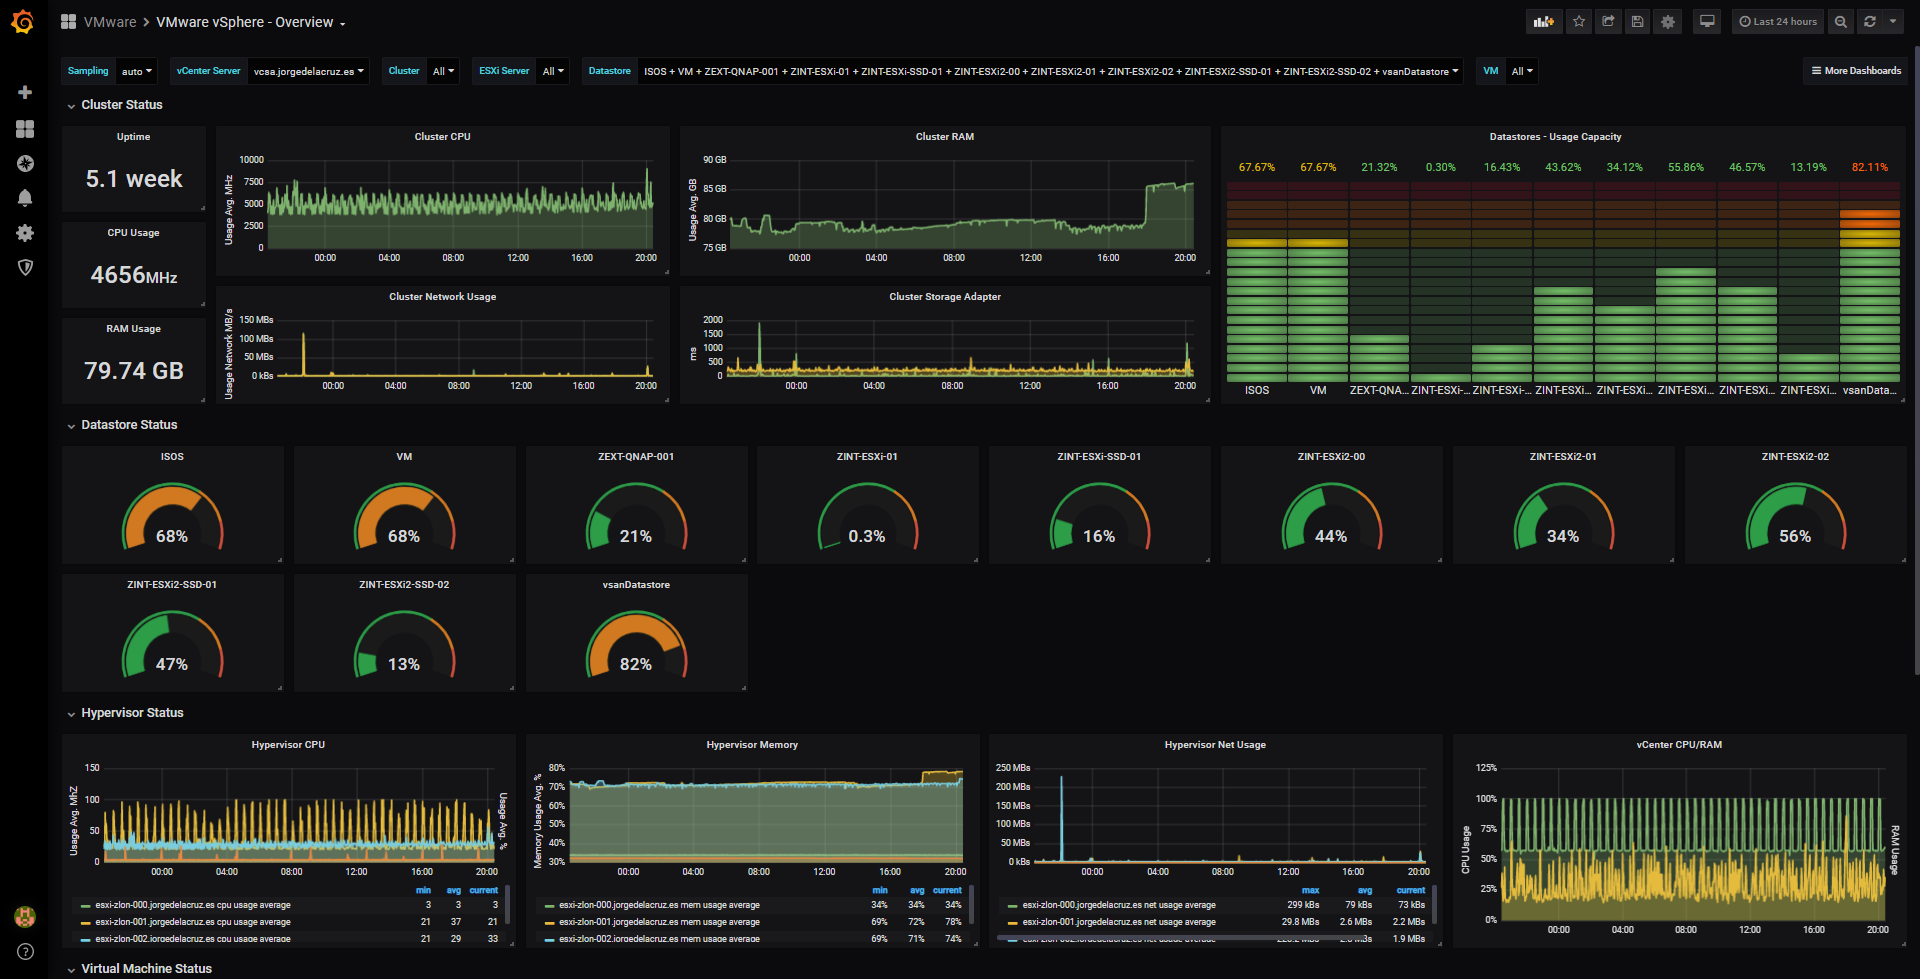
### Grafana 使用入门[](https://support.websoft9.com/docs/grafana#grafana-%E4%BD%BF%E7%94%A8%E5%85%A5%E9%97%A8)
下面以 xxx 配置数据监控作为范例。
### Grafana 常用操作[](https://support.websoft9.com/docs/grafana#grafana-%E5%B8%B8%E7%94%A8%E6%93%8D%E4%BD%9C)
#### 配置 SMTP[](https://support.websoft9.com/docs/grafana#%E9%85%8D%E7%BD%AE-smtp)
1. 在邮箱管理控制台获取 SMTP 相关参数
2. 修改Grafana 配置文件,增加如下的 SMTP 配置段
```
#################################### SMTP / Emailing #####################
[smtp]
enabled = false
host = localhost:25
user =
# If the password contains # or ; you have to wrap it with triple quotes. Ex """#password;"""
password =
cert_file =
key_file =
skip_verify = false
from_address = admin@grafana.localhost
from_name = Grafana
ehlo_identity =
[emails]
welcome_email_on_sign_up = false
templates_pattern = emails/*.html
```
3. 重启服务
```
sudo systemctl restart grafana-server
```
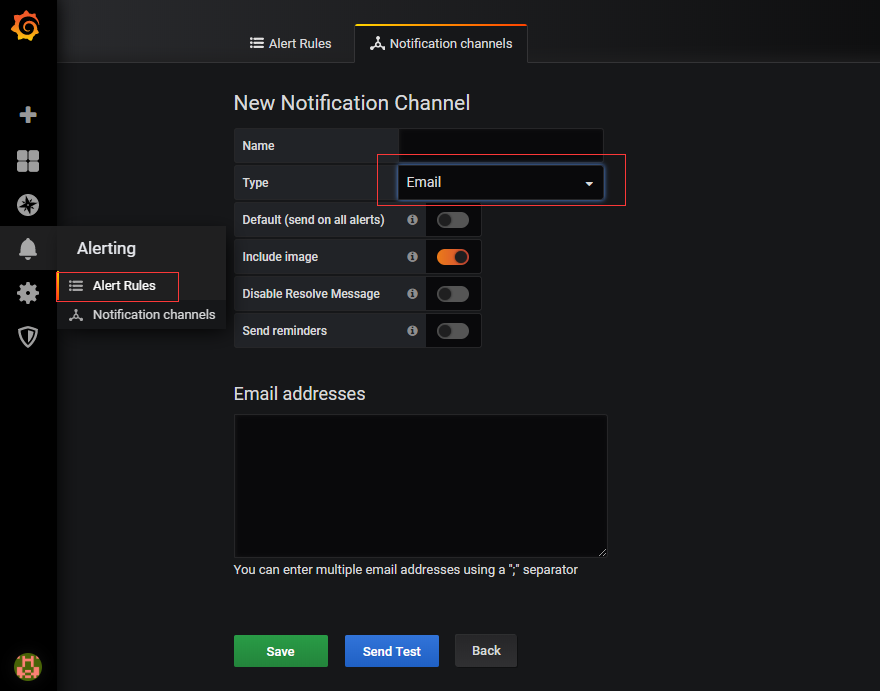
4. 登录 Grafana 控制台,打开:【Alerting】>【Alert Rules】,新建一个【Email】通知渠道
5. 点击【Send Test】
#### 重置密码[](https://support.websoft9.com/docs/grafana#%E9%87%8D%E7%BD%AE%E5%AF%86%E7%A0%81)
SSH 登录服务器,运行下面的命令即可
```
# 修改管理员密码
docker exec -it grafana grafana-cli admin reset-admin-password admin123
```
### Grafana 参数[](https://support.websoft9.com/docs/grafana#grafana-%E5%8F%82%E6%95%B0)
Grafana 应用中包含 Nginx, MySQL 等组件,可通过 **通用参数表** 查看路径、服务、端口等参数。
```
CONTAINER ID IMAGE COMMAND CREATED STATUS PORTS NAMES
0e8348b13542 phpmyadmin:latest "/docker-entrypoint.…" 12 minutes ago Up 12 minutes 0.0.0.0:9090->80/tcp, :::9090->80/tcp phpmyadmin
12bb28a1571e grafana/grafana:latest "/run.sh" 13 minutes ago Up 13 minutes 0.0.0.0:9001->3000/tcp, :::9001->3000/tcp grafana
5eaf5c965651 grafana/promtail:main "/usr/bin/promtail -…" 13 minutes ago Up 13 minutes grafana-promtail
610a9ad5edfe mysql:5.7 "docker-entrypoint.s…" 13 minutes ago Up 13 minutes 3306/tcp, 33060/tcp grafana-db
49b08cdf0e3d grafana/loki:main "/usr/bin/loki -conf…" 13 minutes ago Up 13 minutes 3100/tcp grafana-loki
```
#### 路径[](https://support.websoft9.com/docs/grafana#path)
Grafana 安装目录:*/data/apps/grafana*\
Grafana 配置文件:*/data/apps/grafana/data/grafana\_config/grafana.ini*\
Grafana 日志目录:*/data/apps/grafana/data/grafana\_logs*\
Grafana 数据目录:*/data/apps/grafana/data/grafana\_data*
#### 端口[](https://support.websoft9.com/docs/grafana#port)
无特殊端口
#### 版本[](https://support.websoft9.com/docs/grafana#%E7%89%88%E6%9C%AC)
```
# Grafana Version
sudo docker exec -it grafana grafana-cli -v
```
#### 服务[](https://support.websoft9.com/docs/grafana#%E6%9C%8D%E5%8A%A1)
```
sudo docker l start | stop | restart | stats grafana
sudo docker l start | stop | restart | stats grafana-db
sudo docker l start | stop | restart | stats grafana-promtail
sudo docker l start | stop | restart | stats grafana-loki
```
#### 命令行[](https://support.websoft9.com/docs/grafana#%E5%91%BD%E4%BB%A4%E8%A1%8C)
Grafana 提供命令行工具`grafana-cli`用于全面管理和配置 Grafana
```
$ docker exec -it grafana grafana-cli -h
NAME:
Grafana CLI - A new cli application
USAGE:
grafana-cli [global options] command [command options] [arguments...]
VERSION:
8.4.4
AUTHOR:
Grafana Project
COMMANDS:
plugins Manage plugins for grafana
admin Grafana admin commands
cue Cue validation commands
help, h Shows a list of commands or help for one command
GLOBAL OPTIONS:
--pluginsDir value Path to the Grafana plugin directory (default: "/var/lib/grafana/plugins") [$GF_PLUGIN_DIR]
--repo value URL to the plugin repository (default: "https://grafana.com/api/plugins") [$GF_PLUGIN_REPO]
--pluginUrl value Full url to the plugin zip file instead of downloading the plugin from grafana.com/api [$GF_PLUGIN_URL]
--insecure Skip TLS verification (insecure) (default: false)
--debug Enable debug logging (default: false)
--configOverrides value Configuration options to override defaults as a string. e.g. cfg:default.paths.log=/dev/null
--homepath value Path to Grafana install/home path, defaults to working directory
--config value Path to config file
--help, -h show help (default: false)
--version, -v print the version (default: false)
```
#### API[](https://support.websoft9.com/docs/grafana#api)
[Grafana API](https://grafana.com/docs/grafana/latest/http_api) 采用 REST API 2.0 规范。
---
# Agent Instructions
This documentation is published with GitBook. GitBook is the documentation platform designed so that both humans and AI agents can read, navigate, and reason over technical content effectively. Learn more at gitbook.com.
## Querying This Documentation
If you need additional information that is not directly available in this page, you can query the documentation dynamically by asking a question.
Perform an HTTP GET request on the current page URL with the `ask` query parameter:
```
GET https://docs.imdcinsights.com/ying-yong-zhong-xin/shu-ju-yu-fen-xi/grafana-kuai-su-ru-men.md?ask=
```
The question should be specific, self-contained, and written in natural language.
The response will contain a direct answer to the question and relevant excerpts and sources from the documentation.
Use this mechanism when the answer is not explicitly present in the current page, you need clarification or additional context, or you want to retrieve related documentation sections.